
Considering that it was announced today that Greg LeMond had formed a new venture to sell the Revolution trainer, and that my last post had dealt with the Revolution, I thought it would be a good time to also talk about the Power Pilot device that LeMond sells for use with the trainer. If someone already has a non-wheel based power meter on their bike, then the Power Pilot would be a bit redundant. But, for those who use a PT wheel primarily, or don't have another form of power measurement, the Power Pilot could be a good alternative for determining the "load" during a trainer workout. The
following is a brief look at the power reporting and recording performance of the LeMond Power Pilot. In particular, it is compared to the output of a “known
good” Quarq CinQo crank-based power meter. "Known good" in this sense is a power meter which has had it's torque slope checked and adjusted and has a zero offset that is stable.
BACKGROUND
The
LeMond Power Pilot is a device designed to be used in conjunction
with the LeMond Revolution trainer to primarily monitor and record
the training efforts of the rider. The Revolution trainer is a high
inertia wind trainer with the somewhat unique configuration whereby
the rear wheel of the attached bike is removed and is not a part of
the driven assembly. The chain of the bike drives a rear cassette
which is attached to a relatively high mass flywheel through a belt
drive gear reduction system. In my last blog post ("What's the Virtual CdA and Crr of the LeMond Revolution Trainer"), it was shown that this system
“mimics” the aero drag of a typical sized rider on a road bike
(CdA = ~0.35 m^2) and the rolling resistance of average tires (Crr =
~ .005). The inertial mass was also found to be equivalent to a
rider mass of ~45kg, which although it is less than the mass of a
typical rider, it is far higher than the much lower inertial masses
of most indoor trainers on the market today. This accounts for the
often reported excellent “road feel” of the Revolution trainer.
The
Power Pilot uses an ANT+ sensor to read the drive pulley rotational
velocity, and by extension, the flywheel speed during operation.
Along with the known aero properties of the flywheel fan, the aero
drag power is calculated using that speed measurement and an estimate
of the air density (based upon the user entered altitude, an
internal temperature sensor, and an internal humidity sensor.) The
speed sensor is also used to determine the acceleration/deceleration
of the flywheel mass to account for that in the power reporting.
Additionally, the Power Pilot firmware allows for a coastdown
calibration to be performed which then accounts for any unit to unit
variation in the “fixed” losses of the mechanism.
THE
TEST AND RESULTS
In
order to determine how well the Power Pilot performs these
calculations, it was decided to compare the Power Pilot output to the
power values measured using a Quarq CinQo crank-based power meter.
The particular CinQo used in this testing is a “known good” unit
which has been recently calibrated for torque slope and demonstrates
a very stable zero offset. To make the comparison, a ride was
undertaken whereby a “cassette sweep” was performed. The ride
started with the bike in a gear selection of 53/25 and then
progressed down the cassette every ~1.5 minutes until a gear
selection of 53/12 was used, all the while keeping a constant 60 rpm
cadence. Then, the chainring was shifted to a 39T and the
progression was repeated partially up the cassette. Finally, two
additional runs were taken at a higher cadence (and thus power). A
plot of both power traces vs. time is shown below:

Looking
closely, one can see that aside from a slight offset, the values
reported by each power meter “track” very closely to each other.
This can further be seen if the power values relative to each other
are plotted on a point-by-point basis. The plot below shows the
power reported at each point in time with the CinQo power values on
the x-axis and the Power Pilot values on the y-axis.
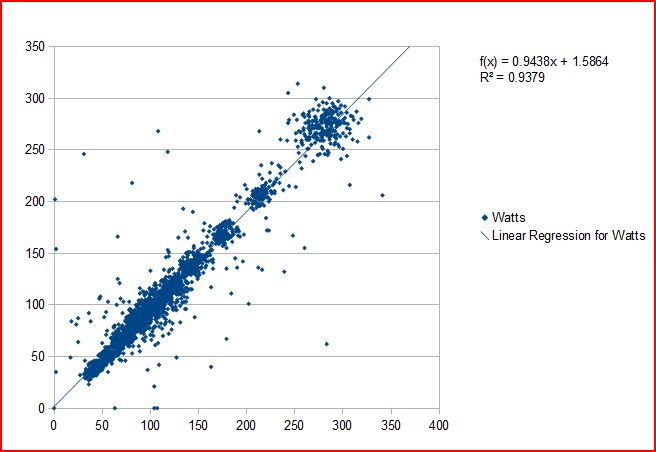
Typically,
due to factors such as variations in recording rates, calculation
algorithms, etc. the sort of plot above doesn't turn out very well as
a comparison tool for power meters. However, in this case, the
point-by-point power reporting is fairly good and it appears that the
Power Pilot reports ~94% of the power reported by the CinQo.
Considering that the Power Pilot estimate is taking place
“downstream” of the bicycle drivetrain losses (much like a
PowerTap wheel) in comparison to the crank-based location of the
CinQo, a ~6% drivetrain power loss is reasonable, and typical of an
average drivetrain.
Rather
than looking at the point-by-point plot and it's curve fit, often
it's more useful to look at a plot of the averages reported by the
power meters over constant power sections. The plot below is the
same as the previous plot, but the averages over each of the
“intervals” of the cassette sweep are plotted and a curve is fit
to them. As can be seen the fit is fairly “tight” to the data
and the slope of the fit (i.e. the drivetrain loss) is similar to
that reported above, albeit slightly lower. This appears to point
out that the correlation between the 2 devices may be slightly better
during constant power efforts. Alternatively, it could reveal that
the time correlation of the point-by-point data looked at above may
be slightly “off”.

However, understanding where
the power meters don't agree
can sometimes be much more enlightening in that it can reveal
systemic difference between the devices. One tool for doing this is
something called a “Mean – Difference” Plot. This plot shows
the difference between the power values reported by the 2 devices
plotted against their average. The Mean-Difference plot of this ride
is shown below:

The things to look for in this type of plot that reveal
systemic “issues” are characteristics like the spread of the
points getting larger or smaller with the mean power values or the
difference not trending in a monotonic fashion. Neither of these
types of issues appear to be present above, implying that the Power
Pilot “agrees” with the CinQo output in a consistent and
predictable manner.
Another area of interest for comparisons of this type
is how the 2 devices respond to sprint type efforts. An additional
ride was undertaken where a pair of short sprints were performed in
order to see if there were any anomalies between how each device
reported these efforts. As can be seen below, the shapes of the
curves are very similar with the peak values also being very close to
each other.

CONCLUSIONS
This brief examination of the power output of a LeMond
Power Pilot on a Revolution trainer shows that it does an acceptable
job at determining and recording the rider's power output when
compared to a “known good” crank-based power meter. The power
output is similar to what one would expect to see from a hub-based
power meter, which is favorable for the likely customer base for this
product, namely users with no other power meter or Power Tap owners
who want to train indoors with and/or by power.
No comments:
Post a Comment